
Track NPS, CSAT, CES, a customer health score, and a small set of outcome KPIs — specifically churn rate, retention rate, and customer lifetime value (CLV) — to get a reliable picture of how your clients actually feel and what they're likely to do next. No single metric tells the whole story. The real power comes from pairing leading indicators (sentiment, effort, engagement) that warn you early with lagging indicators (churn, renewals, revenue) that confirm whether your actions worked.
Here's a quick reference for which metric answers which question:
- NPS (Net Promoter Score): "Would clients recommend you?" Best for measuring overall loyalty and relationship health.
- CSAT (Customer Satisfaction Score): "How satisfied were clients with this interaction?" Best for transactional, post-event feedback.
- CES (Customer Effort Score): "How easy was it to work with you?" Best for spotting friction in your processes.
- Health Score: "Which clients are at risk right now?" Best as an early-warning signal before churn happens.
- Churn Rate / Retention Rate / CLV: "What is client satisfaction actually costing or earning us?" Best for connecting satisfaction to revenue.
Key Takeaways
Tracking a small, well-chosen set of client satisfaction metrics and acting on them consistently is what separates teams that grow client relationships from those that simply manage them.
| Point | Details |
|---|---|
| Track a blended set of metrics | Combine NPS, CSAT, CES, health score, and churn/CLV to cover both early warnings and revenue outcomes. |
| Match metric to moment | Trigger CSAT and CES immediately after milestones; run NPS quarterly or biannually; never survey the same client more than once per quarter. |
| Assign named owners | Every metric on your dashboard needs one person responsible for reviewing it, flagging anomalies, and initiating follow-up. |
| Close the loop within 48 hours | Contacting Detractors quickly is one of the highest-leverage retention tactics available to any service team. |
| Link satisfaction to revenue | Tie NPS and churn targets to CLV impact so leadership sees satisfaction as a revenue driver, not just a service metric. |
Table of Contents
- What are the core client satisfaction metrics and how do you calculate them?
- How to measure and collect these metrics without burning out your clients
- How to build a client satisfaction dashboard that actually drives decisions
- From data to impact: how to close the loop and measure what changes
- Advanced analyses: key driver analysis, cohort analysis, and predictive signals
- Benchmarks and target setting: what realistic ranges look like
- Which tools help you measure and monitor client satisfaction?
- Standards and authoritative guidance worth knowing
- What actually works in practice: a perspective on measurement that sticks
- Sources
What are the core client satisfaction metrics and how do you calculate them?
CSAT, CES, and NPS are the three sentiment metrics most organizations rely on, each answering a different question about the client relationship. Add a health score and a handful of outcome KPIs and you have a complete measurement system.
NPS (Net Promoter Score)
NPS measures loyalty by asking one question: "On a scale of 0–10, how likely are you to recommend us to a colleague or friend?" Scores of 9–10 are Promoters, 7–8 are Passives, and 0–6 are Detractors.
Formula: NPS = % Promoters − % Detractors
A score above 0 is positive; a higher NPS score generally indicates strong loyalty in most B2B service industries. NPS is a relational metric — it captures the overall relationship, not a single transaction, so it works best on a quarterly or biannual cadence.
CSAT (Customer Satisfaction Score)
CSAT asks: "How satisfied were you with [specific interaction]?" on a 1–5 scale, where 4 and 5 are "satisfied."
Formula: CSAT = (Number of satisfied responses ÷ Total responses) × 100
A CSAT score at or above a generally recommended threshold is a reasonable target in most service businesses, though benchmarks vary. This is a transactional metric — trigger it immediately after a support ticket closes, a deliverable ships, or a contract is signed.
CES (Customer Effort Score)
CES asks: "How easy was it to resolve your issue / complete your task today?" on a 1–7 scale (1 = very difficult, 7 = very easy). Lower effort correlates with higher loyalty, as HBR's research on reducing customer friction demonstrates — clients who find working with you effortless stay longer than those who are occasionally "delighted" but regularly frustrated.
Formula: CES = Average score across all responses
Customer Satisfaction Index (CSI)
CSI is a composite score that weights multiple satisfaction attributes (quality, responsiveness, value) by their importance to the client. It's more complex to build than NPS or CSAT but gives a richer picture when you need to prioritize which service dimensions to improve.
Health Score
A health score aggregates behavioral signals — login frequency, feature adoption, support ticket volume, payment history, and engagement with communications — into a single risk indicator. There's no universal formula; you weight the signals that predict churn in your own client base. A client with declining logins, two open support tickets, and a missed payment is a very different risk profile from one with daily activity and zero tickets.
Churn Rate, Retention Rate, and CLV
These are your lagging outcome KPIs. Blending them with leading sentiment metrics on a single dashboard is what separates organizations that react to churn from those that prevent it.
- Churn Rate = (Clients lost in period ÷ Clients at start of period) × 100
- Retention Rate = 100 − Churn Rate
- CLV = Average revenue per client × Average client lifespan
Benchmark note: NPS benchmarks vary widely by industry. The American Customer Satisfaction Index (ACSI) publishes sector-level data that gives you a defensible external reference point for setting your own targets.
How to measure and collect these metrics without burning out your clients
Survey design is where most measurement programs fail. The questions are fine; the timing, channel, and frequency are not.
Survey design basics
Keep transactional surveys to one primary question plus one optional open-ended follow-up: "What's the main reason for your score?" That follow-up is where the actionable insight lives. Resist the urge to add five more questions — every additional question reduces completion rates.
Scale choice matters:
- Use 0–10 for NPS (the standard; deviating makes benchmarking impossible).
- Use 1–5 for CSAT (simple, widely understood, easy to calculate).
- Use 1–7 for CES (the scale most validated for effort measurement).
For free client questionnaire templates you can adapt for CSAT and CES, Realclient's template library is a practical starting point.
Timing and cadence rules
Trigger transactional surveys immediately after milestones — a support ticket closure, a project delivery, an onboarding call. Delay by more than 24 hours and recall fades. For relational metrics like NPS, run them quarterly or biannually. In B2B, never survey the same client more than once per quarter across all survey types combined — survey fatigue is a real retention risk in high-touch service relationships.
Aligning survey triggers to project milestones makes this automatic rather than manual. When a milestone is marked complete, the survey fires.
Channel guidance
| Channel | Best For | Typical Response Rate |
|---|---|---|
| NPS, post-project CSAT | Moderate | |
| In-app / portal | CES, transactional CSAT | Higher (context is immediate) |
| SMS | Short CSAT, quick pulse | High open rate, low completion |
| Phone | Complex B2B accounts, qualitative follow-up | High quality, low scale |
Social listening and review monitoring add a complementary always-on signal. Billions of people use social networks globally, and unsolicited feedback on those platforms often surfaces issues your surveys miss entirely.
Response rate optimization
- Write subject lines that name the specific interaction: "Quick question about your onboarding call" outperforms "We'd love your feedback."
- Keep surveys mobile-first — most email opens happen on phones.
- Send within business hours on Tuesday through Thursday for highest open rates.
- Avoid incentives that attract low-quality responses; a brief, honest explanation of how you'll use the feedback works better.
Pro Tip: Run a pilot with 20–30 responses before full deployment. Check whether the open-ended answers match the numeric scores — if clients rate you 4/5 but write "the process was confusing," your scale may be capturing satisfaction with the outcome, not the experience.
Implementation checklist
- Define which metric maps to which client touchpoint.
- Write the primary question and one open-ended follow-up.
- Choose the channel and set the trigger condition.
- Pilot with a small sample and review response quality.
- Adjust wording if scores and qualitative answers diverge.
- Deploy and set a reminder to close the feedback loop within 48 hours of each response.
How to build a client satisfaction dashboard that actually drives decisions
A dashboard is only useful if it tells you what to do next. That means combining metrics that warn you early with metrics that confirm results — and assigning a human owner to each one.
Leading vs. lagging balance
Leading indicators (NPS trend, CES, health score, engagement rate) tell you where satisfaction is heading. Lagging indicators (churn rate, renewal rate, CLV) tell you where it went. Leading organizations blend both on a single success metrics dashboard so no signal exists in isolation.
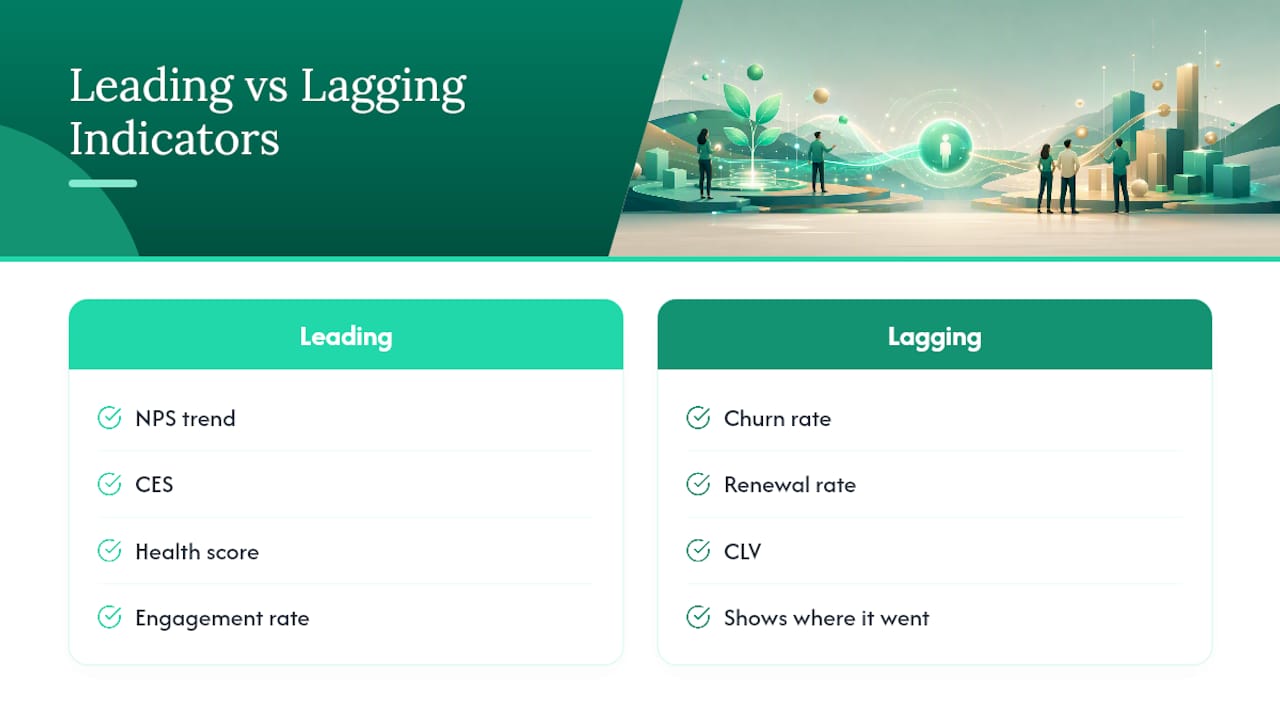
A common mistake is building a dashboard of lagging metrics only. By the time churn shows up in your numbers, the client has already decided to leave. Health scores and CES trends give you a 30–90 day window to intervene.
Dashboard template
| Metric | Visualization | Cadence | Owner | Alert Threshold |
|---|---|---|---|---|
| NPS | Trend line (rolling 90-day) | Quarterly | Head of Client Success | Drop of 5+ points |
| CSAT | Bar chart by touchpoint | Weekly | Account Manager | Below 100% |
| CES | Average score trend | Weekly | Operations Lead | Below 7 (on 1–7 scale) |
| Health Score | Distribution histogram | Daily | Account Manager | Any client drops to "at risk" |
| Churn Rate | Cohort table | Monthly | CEO / Revenue Lead | Exceeds industry benchmark |
| Open Feedback | Live text feed | Daily | Account Manager | Any Detractor response |
Aggregation intervals
Behavioral data (logins, feature usage, support tickets) updates daily and feeds the health score. Sentiment metrics (CSAT, CES) aggregate weekly. NPS aggregates quarterly. Mixing these cadences on one dashboard without labeling them clearly creates confusion — a weekly NPS number based on three responses is statistically meaningless.
Combining survey data with CRM and behavioral signals is what makes a health score predictive rather than descriptive. A tool like Realclient centralizes client communication, file sharing, and milestone tracking in one portal, which means behavioral signals are already being captured in the same place where client work happens.
Pro Tip: Assign a single named owner to each metric row in your dashboard. "Everyone owns NPS" means no one does. The owner's job is to review the metric weekly, flag anomalies, and initiate the response protocol when a threshold is breached.
From data to impact: how to close the loop and measure what changes
Collecting data is the easy part. Acting on it quickly is what separates teams that improve from teams that just report.
Why closing the loop within 24–48 hours matters
Closing the loop quickly on negative feedback is one of the highest-leverage retention tactics available. A Detractor who receives a personal follow-up within 48 hours is far more likely to stay than one who hears nothing. The follow-up doesn't need to solve the problem immediately — it needs to acknowledge it and commit to a next step.
A simple follow-up script: "Hi [Name], thank you for your honest feedback. I can see this wasn't the experience we want for you. I'm looking into [specific issue] and will have an update for you by [specific date]. Is there a good time to talk?"
Prioritization framework
Not every piece of negative feedback deserves equal attention. Use an impact vs. effort matrix:
- High impact, low effort: Fix immediately. These are your quick wins — a confusing email template, a missing status update, a slow response time.
- High impact, high effort: Schedule for the next planning cycle with a clear owner and timeline.
- Low impact, low effort: Batch and address in regular process reviews.
- Low impact, high effort: Deprioritize. These rarely move the metrics that matter.
Running small experiments before full rollout
Before changing a core process based on survey feedback, run a small operational pilot with one client segment or one team. Measure CSAT and CES before and after. If the pilot shows improvement, roll out broadly. If it doesn't, you've learned cheaply.
Pro Tip: Track the NPS or CSAT of clients who received a follow-up call after a Detractor response vs. those who didn't. That comparison is often the clearest proof of ROI for your feedback program.
Closing the loop: a numbered checklist
- Review all new responses within 24 hours.
- Flag every Detractor (NPS 0–6) or low CSAT (1–2) for immediate follow-up.
- Assign the follow-up to the named account owner.
- Contact the client within 48 hours with a specific acknowledgment and next step.
- Log the issue category (process, communication, product, pricing) for root-cause analysis.
- Track whether the client's next survey score improves.
- Report monthly on the percentage of Detractors converted to Passives or Promoters.
Advanced analyses: key driver analysis, cohort analysis, and predictive signals
Once you have three or more months of consistent data, you can move beyond tracking averages and start identifying what actually drives satisfaction up or down.
Key Driver Analysis (KDA)
KDA is a statistical technique that identifies which service attributes (responsiveness, communication quality, delivery speed, pricing clarity) have the strongest correlation with your overall satisfaction score. Instead of guessing which process to fix, KDA tells you which lever moves NPS or CSAT the most.
To run a basic KDA, you need:
- An overall satisfaction score (NPS or CSAT) as the dependent variable.
- Attribute ratings from the same survey (e.g., "Rate our responsiveness on 1–5").
- A minimum sample size large enough to produce reliable correlations (more on this below).
- A regression or correlation analysis tool (Excel, SPSS, or a platform like Qualtrics).
The output is a ranked list of drivers. If "clarity of project updates" has the highest correlation with NPS but "response speed" has the lowest, you know where to invest first.
Combining survey responses with behavioral data and segmentation makes KDA significantly more powerful. A client who rates communication 3/5 but logs in daily is a different case from one who rates it 3/5 and hasn't opened the portal in two weeks.
Cohort analysis
Segment your clients into cohorts — onboarding (first 90 days), established (90 days to 1 year), and long-term (over 1 year) — and track satisfaction trends separately for each group. Onboarding cohorts almost always show higher satisfaction volatility. A dip in CSAT at day 30 is a different problem from a dip at month 8.
You can also segment by ARR tier, use case, or industry vertical. If your enterprise clients score NPS 60 while your small-business clients score NPS 30, the root causes are almost certainly different and require different interventions.
Predictive signals and early-warning models
A simple early-warning model combines three signals:
- Health score trend (declining over 30 days)
- CES score (above average effort in last interaction)
- Usage frequency (logins or feature use below baseline)
Any client showing all three signals simultaneously is a high churn risk. Flag them for proactive outreach before they submit a cancellation request. You don't need a machine learning model to do this — a spreadsheet with conditional formatting works at small scale.
Pro Tip: KDA requires a minimum of roughly 100 responses per segment to produce statistically reliable driver rankings. Below that threshold, treat KDA output as hypothesis generation, not confirmed findings. Small-sample KDA can mislead you into fixing the wrong thing.
Benchmarks and target setting: what realistic ranges look like
Benchmarks give you context, but they can also mislead you if you apply them without adjusting for your business model, client base, and industry.
Why benchmarks vary
A SaaS company with 500 small-business clients has a fundamentally different satisfaction dynamic than a boutique agency with 20 enterprise accounts. Churn rates vary significantly by industry, and NPS benchmarks follow the same pattern. Applying a consumer retail NPS benchmark to a B2B professional services firm produces a misleading target.
The ACSI's national and sector data and Forrester's Global Customer Experience Index are two authoritative public references for U.S. industry-level benchmarks. Use them as directional guides, not hard targets.
Illustrative benchmark ranges
| Metric | B2B Services (Illustrative) | B2C / E-commerce (Illustrative) | Notes |
|---|---|---|---|
| NPS | 30 | 20 | Varies widely by industry and survey methodology |
| CSAT | 80% | 100% | Scale and question wording affect comparability |
| CES | 7 (on 1–7) | 7 (on 1–7) | Higher = easier; B2B tends to score higher with dedicated support |
| Annual Churn | 5–10% | 10% | Subscription vs. transactional models differ significantly |
These ranges are illustrative. Your baseline measurement is more useful than any external benchmark for setting year-one targets.
How to set defensible targets
- Measure your baseline for 60–90 days before setting any target.
- Set incremental goals: a 5-point NPS improvement or a 3% churn reduction is more credible than "reach industry average" when you don't know where you started.
- Link to revenue KPIs: a 5% churn reduction has a calculable CLV impact. Tying satisfaction targets to revenue makes them meaningful to leadership.
- Segment your targets: your top-tier clients by ARR may warrant a separate NPS target from your entry-level segment. Treating all clients as one group hides the segments where you're losing the most value.
Which tools help you measure and monitor client satisfaction?
The tool landscape breaks into four categories. The right choice depends on your team size, technical resources, and how deeply you need to integrate survey data with other business systems.
Tool categories
- Enterprise CX platforms (e.g., Qualtrics): Full-featured survey design, advanced analytics, KDA capabilities, and enterprise-grade integrations. Best for mid-market and enterprise teams with dedicated CX staff and a budget to match. Qualtrics offers robust closed-loop workflows and role-based dashboards that suit complex, multi-team environments.
- Lightweight NPS/CSAT tools (e.g., Retently): Purpose-built for NPS and CSAT collection with simpler setup, automated follow-up sequences, and clean reporting. Retently is a practical choice for subscription businesses that want reliable metric tracking without the overhead of an enterprise platform.
- In-app survey SDKs: Embed short surveys directly inside your product or portal at the moment of interaction. Response rates are typically higher because the context is immediate.
- Integrated client portals: Platforms like Realclient capture behavioral signals (logins, file downloads, message response times, milestone completions) alongside structured feedback, giving you a combined view of engagement and sentiment in one place. For freelancers and agencies already using a client portal, this avoids the need to stitch together a separate survey tool with a separate analytics platform.
Integration advice
Satisfaction data in isolation is less useful than satisfaction data combined with billing, support, and usage signals. When evaluating any tool, check:
- API access: Can you pull survey responses into your CRM or dashboard automatically?
- Data ownership: Who owns the response data if you cancel the subscription?
- Reporting granularity: Can you segment results by client tier, account manager, or product line?
- Sample size visibility: Does the platform flag when a segment's sample is too small to be reliable?
Avoid tools that lock your historical data behind a proprietary format. Portability matters when you switch platforms or need to run external analysis.
Pro Tip: Before committing to any survey platform, export a sample dataset and open it in Excel or your BI tool. If the export is messy, incomplete, or requires a developer to parse, that's a signal about how much control you'll actually have over your own data.
For a broader look at client tracking software options and how they compare on integration depth, Realclient's blog covers the practical tradeoffs in detail.
Standards and authoritative guidance worth knowing
Measurement without a methodology framework is just data collection. These references give your program a defensible foundation.
ISO 10004:2018
ISO 10004:2018 provides international guidelines for monitoring and measuring customer satisfaction. It applies to organizations of any size or type and covers how to define the scope of measurement, design data collection processes, analyze results, and use findings to improve. It's not a certification standard — you don't get audited against it — but it's the closest thing to a universal best-practice framework for satisfaction measurement.
Key takeaways for managers:
- Define what "customer satisfaction" means in your specific context before you measure it.
- Separate the measurement of satisfaction with the product/service from satisfaction with the relationship.
- Build a process for communicating findings internally and acting on them — measurement without action violates the spirit of the standard.
ISO 10004:2018 core principle: "The organization should establish a process for monitoring and measuring customer satisfaction that is systematic, consistent, and aligned with the organization's objectives — covering planning, data collection, analysis, and use of findings to drive improvement."
HBR and Forrester
HBR's research on customer effort makes a point that many satisfaction programs miss: consistently meeting core expectations drives more loyalty than occasional "wow" moments. If your CES scores are poor, no amount of surprise-and-delight will compensate. Fix the friction first.
Forrester's Global Customer Experience Index benchmarks corporate CX performance across industries and provides a framework for understanding where your experience investments are likely to generate the most return. It's particularly useful for teams making the case to leadership that CX investment has a measurable revenue impact.
Authoritative references:
- ISO 10004:2018 for measurement methodology and process design.
- ACSI for U.S. sector-level satisfaction benchmarks.
- HBR for the evidence base behind effort reduction and loyalty.
- Forrester CX Index for competitive benchmarking and investment prioritization.
- Zendesk's measurement methods guide for a practical overview of CSAT, CES, and NPS in service contexts.
What actually works in practice: a perspective on measurement that sticks
Most teams that struggle with satisfaction measurement aren't failing at the metrics. They're failing at the governance.
The most common pattern: a manager sets up an NPS survey, collects responses for a quarter, shares the score in a slide deck, and then nothing changes. The score becomes a vanity metric because no one owns the follow-up, no threshold triggers an action, and the data never connects to a decision.
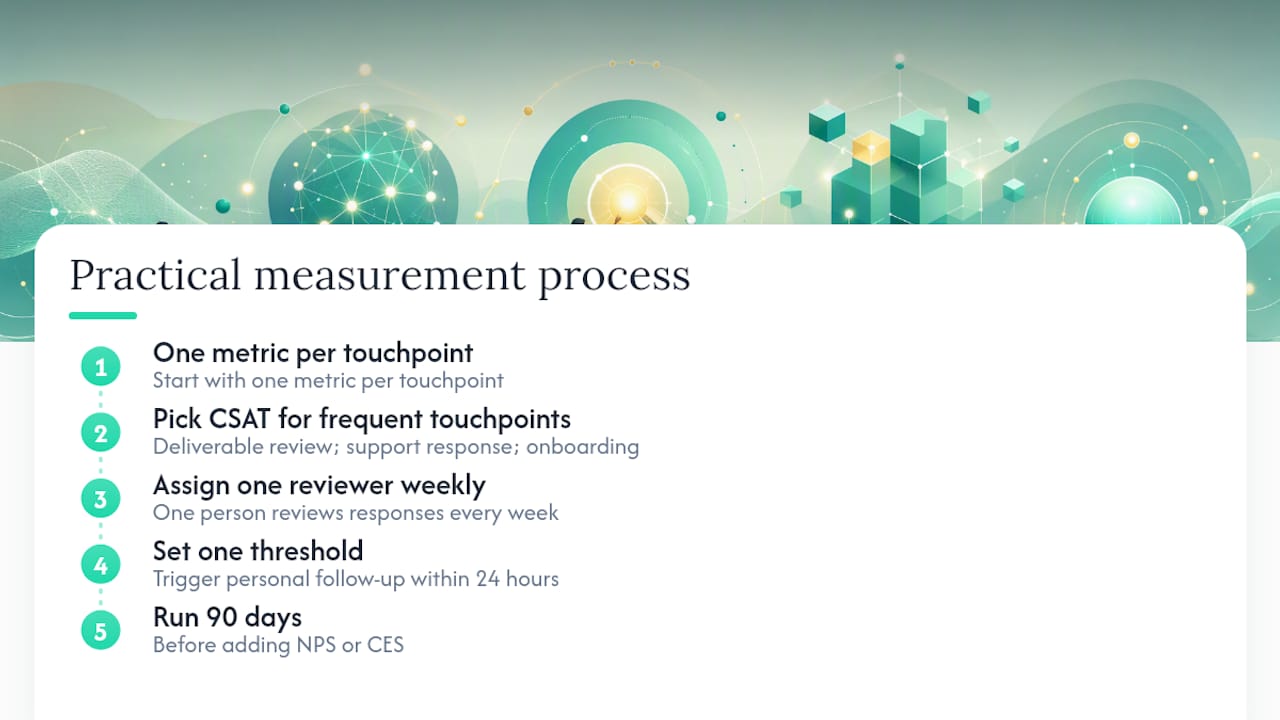
What works is simpler than most guides suggest. Start with one metric per touchpoint. Pick CSAT for your most frequent client interaction — a deliverable review, a support response, an onboarding call. Assign one person to review responses every week. Set one threshold that triggers a personal follow-up. Do that for 90 days before adding NPS or CES.
The teams that improve fastest are the ones that close the loop consistently, not the ones with the most sophisticated dashboard. A client who receives a personal response to their feedback within 24 hours will tell you more in that conversation than six months of survey data. That conversation is also where you learn what your survey questions aren't capturing.
A few operational realities worth naming: over-surveying is a real risk in B2B, where your clients are also professionals with limited time. Sending a CSAT after every email thread will train clients to ignore your surveys. Reserve surveys for moments that genuinely matter. And align your team's incentives — if account managers are measured only on revenue retention, they'll resist sharing negative feedback upward. Satisfaction metrics need to be part of the performance conversation, not a separate reporting exercise.
Realclient's portal model is worth considering here. When client communication, file sharing, milestone updates, and feedback all live in one place, you get behavioral signals automatically — without asking clients to fill out another form. That ambient data (response times, login frequency, milestone acknowledgment rates) often tells you more about satisfaction than a quarterly NPS survey.
Sources
These are the references worth bookmarking as you build or refine your measurement program:
- The 15 customer success metrics that actually matter in 2026
- 4 client satisfaction metrics every accountant should track | Xero US
- ISO 10004:2018 - Quality management — Customer satisfaction — Guidelines for monitoring and measuring
- 5 methods for measuring customer satisfaction
- How to measure customer satisfaction with market research | YouGov
- Stop trying to delight your customers | HBR
- National ACSI Q4 2024 press release